‘Fuel poverty’ is a new view of the old issue of deprivation in Britain; and yet it is simply a modern dimension to the issue of well-being and inequality deliberately created by the British state as a matter of ‘choice’ – which many fail to see the significance of.
Traditionally, philosophers on the political left and right have talked of the State’s ‘Monopoly on Violence’1. In the modern world, though, that idea of forced coercion has become far more nuanced; and in fact, for most people, it’s not even consciously considered. As a result, from earnest poverty campaigners, to ‘Insulate Britain’ protesters, what many people fail to consider is the systemic, policy-based nature of inequality and poverty in the modern technological society: Quite literally, ‘The State’s Monopoly on Hunger’2.
When the only forms of communication were immediate – person-to-person – people were truly able to express themselves, one to another; and reflect upon their conditions; and where necessary act upon those conditions to change them. Today a large part of the public’s world-view is filtered through the mass media, largely controlled by people who are not part of3 that ‘majority community’. Made worse by the recent collapse of local media outlets, shared perceptions of local conditions are not reinforced; and if anything, are largely dismissed as people are distracted by other, irrelevant issues from beyond their immediate community.
The discussion of Britain’s social class structure4 is rooted in a pre-World War II economic model that bears little relationship5 to life today. If politics is perceived as increasingly remote from people’s daily lives, it’s because both the political class, and the media who communicate their daily antics, are socially and geographically both ‘a class apart’6 from most people in Britain. They do not perceive most people’s daily experience, and so cannot engage7 with it.
The bottom 10% of society, the lowest ‘income decile’8, have been in recession for the last twenty years – long before the media awoke to the current ‘cost of living squeeze’9 when it began to pressure the middle class. Even then, the focus of the resulting debate on inequality leans toward the disparity between the middle classes and the top 10%10, not the middle classes and the bottom 10%.
For the last year or so there’s been an upsurge in discussions over ‘food banks’11 and ‘fuel poverty’12. Both have been a reality for the poorest in society for many years13. Though there is a universal human right to food14, in Britain no such legal right exists – despite the fact malnutrition in England has been estimated to add 15%15 to the costs of social and health care services.
‘What gets measured gets managed’: In terms of ‘hunger’ and ‘malnutrition’16 – both of which have been on the rise in Britain for a couple of decades – the lack of any formal framework to assess hunger means the statistics on this trend are very poor; and that lack of an official statistical frame allow the political class and the media to easily ignore the issue.
In contrast, ‘fuel poverty’17 – based on what is termed the ‘Low-Income High Costs indicator’18 – is different: We’ve a good statistical basis for defining fuel poverty, and mapping its incidence.
Contrary to many articles, fuel poverty is not a direct measure of the difference between the costs of home heating and people’s income. The method to calculate the statistics encompasses income and costs, as well as a measure of housing quality, set within a small geographic urban boundary – and so it measures far broader geographic social trends than simply ‘paying the fuel bill’.
As a result, fuel poverty is a good proxy for hunger, and general deprivation, beyond what has been traditionally captured by the political debate – which is focussed primarily on income and employment. In a state where ‘landless’ people are corralled into poor urban housing, and subject to the vicissitudes of centuries-old social prejudice19, it is a measure of the state’s ‘monopoly on hunger’20.
1. Middle class campaigners and media pundits don’t understand ‘fuel poverty’
What makes fuel poverty a good metric for general deprivation is that it is not attached solely to income, and thus the power to consume. All-too-often, anyone who does not fit into21 that largely middle class model of consumption – of ‘aspiration porn’22 – is airbrushed from the dominant social dialogue23.
‘Small area estimation’ is a new tool that the Office for National Statistics have been developing for a few years. Usually government statistics represent the nation, or the geographical boundaries of ‘political’ councils, parishes, or wards. The ONS’ lowest level statistical unit – the ‘Lower layer Super Output Area’24, or ‘LSOA’ – steps beyond the purely political demarcation of communities to look at the nature of the what actually exists on the ground: The varying housing types that define communities; which creates the social patchwork of urban areas; and defines the life of each community. Each LSOA covers 350 to 1,500 households, and so is able to show the small variations in local communities in more detail25 than has traditionally been the case with those larger statistical units.
For fuel poverty, the statistics embody a measure of housing quality26; but as communities tend to divide along economic lines, the LSOAs strongly reflect the socio-economic barriers that are erected across the urban landscape – and are extended or reformed as new developments redefine those traditional community boundaries.
These details have been ignored in the debate on fuel poverty, and the statistical basis for the variations across urban communities that it captures.
The issue here is statistical randomness27: Take two dice; repeatedly throw them, add the values and write down the results. After many rolls the trend produces what is called the ‘normal distribution’28, or ‘bell curve’.
Dice rolling, probability, and the ‘normal distribution’.
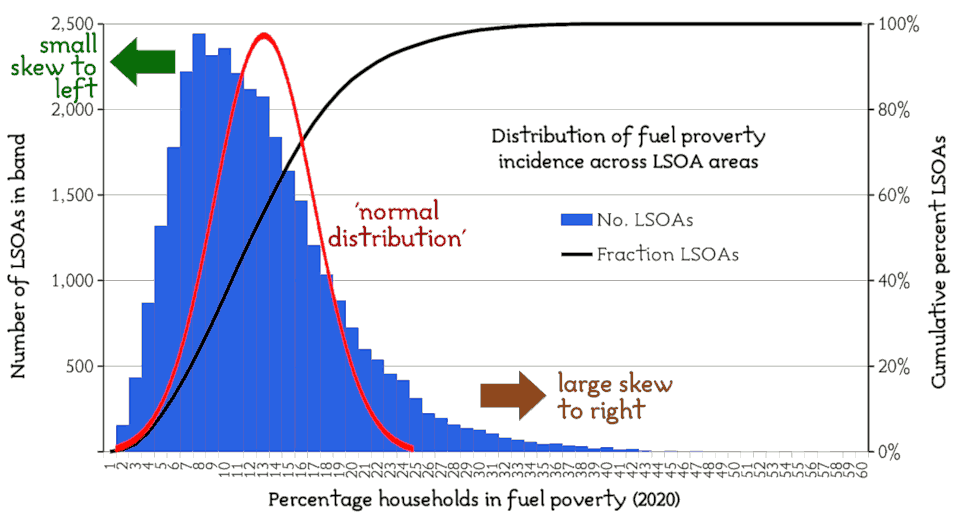
Irrespective of affluence all areas have varying incomes, housing quality, and all have equivalent energy prices. If fuel poverty had no basis beyond just energy prices and income, plotting the fuel poverty rates across all English LSOAs29 should produce a response near to the ‘normal distribution’.
The fact is, when you do that, the results are not a randomly ‘normal’ distribution but a highly skewed one – as shown in this graph.
‘Fuel poverty’ is defined by broader social and economic factors which vary across the urban landscape – not least that poor and affluent housing areas are often segregated. This is shown in the graph because the data is positively skewed30, against ‘random chance’, indicating the problem is something acting across society – beyond a general lack of thermal insulation31 or affordable energy.
There is a small left-ward skew representing the lower than statistically ‘random’ level of fuel poverty in a minority of – primarily more affluent – areas;
There is a far larger right-ward skew, with a tail extending to the right side, which represents the large number of households in fuel poverty at levels far higher than ‘chance’ – indicating that there are other processes at work outside of the immediate causes of ‘fuel poverty’ for approximately 15% to 20% of households.
To act as if solving fuel poverty were just a matter of better insulation32 – as some eco-campaigners assume – is clearly misinformed. It’s more complicated than that! Insulation would obviously help, but the reasons why certain people cannot pay their energy bills, while others have no concern at all, is a situation where many systemic factors combine.
Recent, highly class-biased discussions about fuel poverty38 have divergent meanings across the class spectrum; and can be highly alienating to those who have been subject to39 these pressures for far longer than the recent surge in fuel and food prices. For the 20% of40 the population ‘officially’ known41 to be living in poverty – which also correlates to the scale of that right-ward skew shown on the graph earlier – this is a problem that’s not only ‘old’, it’s intergenerational.
2. A snapshot of structural inequality – Banbury and Oxfordshire
Rather than focussing on all of England, looking at the variations in LSOAs across small areas shows the ‘asymmetric inequalities’ that policy decisions at all levels of government create – exacerbating intergenerational inequality.
The area around Banbury, distinct topographically and geographically from the rest of Oxfordshire, is known locally as, ‘Banburyshire’42. Though the local tourist lobby promote that label, they won’t acknowledge the fact that it is a vestige of the 1834 Poor Law43 system, and the large ‘union workhouse’44 which once stood in Warwick Road.
When Banbury was redeveloped after World War II, new housing estates were built on the land adjoining the workhouse, and the town’s Victorian heart (my childhood home included) were subject to ‘slum clearance’. But despite this new start, the historic systems of social division and the maintenance of economic inequality were preserved.
We still see this today within the map of LSOAs in Banbury: Though the political boundaries of the town have changed after decades of expansion, the core of post-war estates, and the remaining Victorian housing areas, have the highest levels of fuel poverty.
Banbury is the largest town in Cherwell District: Of the 94 LSOAs in the District, roughly a third are in Banbury; but of the ‘worst fifth’ LSOAs in the District, two-thirds of those are in Banbury.
The highest poverty and health inequality45 persist in those social housing developments built from 1950s to the 1970s; and today, that housing situation is exacerbated by the collapse of affordable housing provision – to the point where the local Tory council46 is offering to pay those on the housing list to leave the area.
The situation in Banbury has been maintained as a result of both District and County development and spending policies over successive decades. Banbury has been a ‘sacrifice zone’47 for problematic developments in Oxfordshire for many years. Banbury has the highest air pollution levels48 in the county, with ‘air quality management zones’49 covering large parts of the town – which is known to make50 those pre-existing health inequalities worse.
We can see similar policies enacted routinely across much of England over many decades, not just in North Oxfordshire alone. Intrusive and polluting developments have consciously been sent to Banbury; while other, more affluent areas are spared such development. This holds-back the ‘levelling-up’ of economic development as poor-quality land uses – such as warehousing – are sent to the north of the county; while more high-value developments – such as science and engineering – are directed to the south of the county.
This deliberate policy of sacrificing some areas to protect the amenity others can be seen in the graph of fuel poverty data for the county:
The affluent Districts to the south and west of Oxford have relatively low levels of fuel poverty. Just like the national picture, these more affluent districts trend to the left-hand-side of the ‘normal’ distribution.
Oxford has some of the highest levels of deprivation in the county – with large areas of poor quality housing, and average rates of fuel poverty far higher than the rest of the county. This pushes its LSOAs to the right-hand-side.
Cherwell is distinct from Oxford, and the other districts, in that it has both affluent areas with low levels of fuel poverty, and high levels of fuel poverty concentrated mainly in Banbury. This spreads Cherwell’s LSOA’s across the graph.
What this means is that within Cherwell the extremes of affluence and poverty exist far closer together – manifesting as the stark level of inequality that exists within Banbury. This is not the result of random chance, but of many years of deliberate decision-making, at local and national level, that willingly maintains local pockets of deprivation, while locating economically advantageous developments elsewhere.
3. ‘Modern British society abandons those it cannot economically exploit’
The poorly qualified; those with long-term disabilities; those who cannot adjust to the digital workplace or ‘gig’ culture – these are the people that the modern economy cannot find a place for. They are rarely depicted within the consumption-centric mass media dialogue. They are not the focus of the dominant political narrative, nor of political coverage. They are rarely given access to the media, except when subject either to disparaging depictions or being elevated to curiosities in ‘poverty safaris’51.
It’s easy to say this state-sanctioned maintenance of hunger and ill-health is a ‘conscious decision’. The fact is, it is a singularly ‘unconscious decision’ by those implementing these policies. They are aware of their prejudicial decision-making, and failure to treat their own citizens with equal respect. Instead they maintain an unconscious bias, a willing ignorance, because doing otherwise would require them to clearly state their social bigotry and lack of (for want of a better term) ‘Christian morality’.
What people fail to realise is that this same mode of thinking not only enables the poverty of Banbury, but also the growing levels of wealth inequality across Britain generally:
This crisis – far worse in England52 – started not with the Ukraine war but in the Sixteenth Century!
The dissolution of the monasteries53, and the seizure of their wealth by the aristocracy, removed the systems of social welfare for English people; then the inclosure of the common land54 took away people’s ability to provide food and fuel for themselves without ‘working’ for it.
As a result, within half a century, as the numbers of landless and those ‘without means’ ballooned, the violent persecution of ‘vagabondage’42 was systematised into a process of punishing poverty and illness under the ‘Poor Laws’43 – and its principal means of control, ‘industrialised’ in various guises under the Act of 183455, was the workhouse56.
That system continued, growing ever larger, until 1948 – when it was replaced by the National Health Service and National Assistance57. However, for the physically and mentally disabled, this institutionalisation58 of long-term illness arguably continues59 until today, through the additional degradations they are subjected to under the failing care system.
Put simply, at the beginnings of ‘modern’ England, the gentry and rising mercantile class grabbed the state’s assets and impoverished the people to pay for that; and this cycle has repeated a number of times over the centuries. Most recently in the wave of state privatisations, and the squandering60 of North Sea revenues, under the Thatcher government61; to the recent decade of Tory austerity cuts62 to pay for the collapse of the financial system in 2008. Public services have become so bad in many parts of Britain that it’s been flagged by economists as being, ‘bad for business’63.
Now we face the same process again to pay for the current crisis, even though the debt created by that crisis has primarily benefited64 the elite who control Britain’s wealth.
If a person were to deliberately starve or punish an animal in their care they would be subject to prosecution or the removal of the animal. If a person were to deliberately starve a person in their care, or physically punish a person for failing to work adequately, they would be liable to charges of assault or carrying out ‘modern slavery’. And yet, when – for five centuries – an economic elite has consistently starved and punished a large section of the national population, for failing under a system which that elite created, this conduct is not only considered morally and politically sound, but also the fault of the people the policy is applied to.
Within Banbury, as a result of these policies, the town has stark inequalities in education, employment, pollution, and health, compared to the rest of the local District, and the rest of the County outside of Oxford. And as Banbury is to Oxfordshire, at a far larger and more extreme level, that is the same, deliberate enactment65 of policy which has been applied to ‘the desolate north’66 for centuries.
To quote Darren McGarvey67, “I no longer believe poverty is an issue our politicians can solve. Not because they don’t want to, but because an honest conversation about what it will require is too politically difficult to have.” Debates about poverty and inequality are played-out mainly by those – the affluent – who are the leading cause68 of these problems. They absolve themselves of responsibility by blaming ‘the other side’ in politics, and yet all ‘sides’ in British politics have been complicit in the maintenance of poverty and inequality for centuries.
There are solutions, but that must begin with action by those subjected to these policies, refusing to accept the economic elite’s political dialogue: They must refuse to be ignored by that elite; and confront them with their own bigotry and immorality. This is a basic principle, that’s been sought69 since the take-over of the state by that financial elite in the Sixteenth Century, and which has been suppressed for almost four hundred years by the English state: “...That the poorest he that is in England has a life to live as the greatest he”.