“We just need houses to be more efficient”, I was told. That’s the problem with people who make (or is it, repeat?) simplistic statements; the very fact they can make such a statement, without apparently any understanding of why it is not appropriate in the circumstance, means you’re going to have a problem convincing them otherwise.
Will eliminating carbon emissions from housing ‘help’ to address climate change?: Yes.
Will eliminating carbon emissions from housing have any ‘significant’ effect on climate change?: No.
The ‘net’ effect1 of reducing household energy consumption, as a proportion of all energy consumption, is not large enough to make a significant ‘net’ reduction in carbon emissions – in terms of the scale of change required in the next decade.
The more direct energy consumption is reduced, the more it puts the emphasis on ‘indirect’ consumption2 – all the energy and carbon hidden in all the ‘other stuff’ in your house that’s not part of the daily use of heat or electricity in the home.
That’s quite a complicated idea, I know, but I’m going to explore an even simpler take on this issue: In summary, “Thermodynamics says no”.
A good proportion of ‘green’ commentary exists in isolation of both objective statistics and technical detail. To have broad appeal it creates a simplistic argument, and therein the limits to change are lost.
Such ‘details’ are the rocks upon which simplistic arguments crash and wreck themselves. The detail, in this case, being the role of thermal insulation in cutting energy consumption, or not, and therefore reducing carbon emissions, or not.
I was being told that insulating homes would reduce energy consumption and carbon emissions. Unfortunately that’s not always true. Nor is ‘efficiency’ an open-ended process. Unless you understand that very basic principle you are not going to understand why many of the larger arguments surrounding energy efficiency are not only limited, but can easily backfire6.
We describe the world mathematically – hence the headings in this post.
I was being asked to accept that increasing efficiency, by adding more insulation, would decrease energy consumption. That process begins with the above heading.
From builder’s merchants to green campaigners, the detail of how well a section of insulation performs is often reduced to a single figure, called a U-value7. That’s a measure, as Watts per square metre, of how much energy flows through a layer of insulation, a wall, or a door, or a window, per degree Celsius difference in the temperature between its two sides.
What the heading of this section says is:
1 divided by the U-value for the material, Um;
Multiplied by the thermal conductivity8 constant for the insulation material, λm;
Will produce the required thickness of that insulation material in metres, Tm.
When we talk about energy efficiency reference is often made to ‘Building Regulations’9, or design standards such as the ‘Passive house’10’. These specify many aspects of design as overall U-values. The idea is that by reducing the complicated design process to a simple target figure, we can ensure a certain standard of heat loss is met without prescribing the detail as to how architects and planners should go about achieving it.
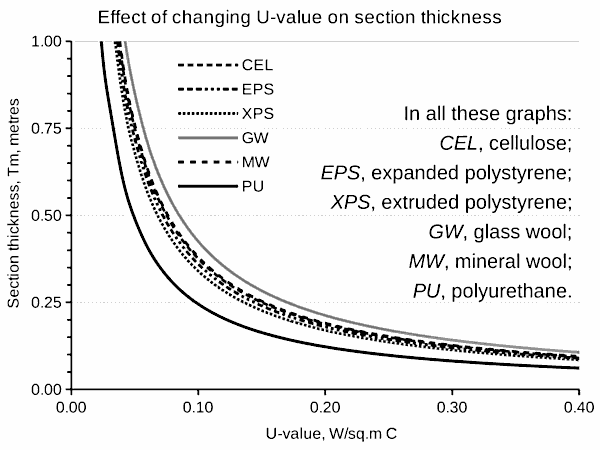
Graph 1. Thermal transmittance (U-value) versus section thickness
Different insulation materials have different thermal conductivity values. Plotting the function in the heading with those values produces the graph on the right.
Let’s get two very obvious things out of the way first:
It’s not a straight line. In fact, it’s quite a sharp deflection, meaning that at U-values of less than 0.1 the thickness of insulation required to produce the U-value rapidly increase.
Though the six common insulation materials chosen are different, their effectiveness as insulators is not drastically different: Polyurethane (PU) out-performs the rest; traditional, cheap glass-fibre or glass-wool is the least thermally efficient; but the other four cluster around the same value.
What this means is that at very low and at higher U-values, the different insulators make little difference to each other; it’s only between 0.4 and 0.05 where the differences between them really show up.
It is no coincidence that same band of values is where the debate about insulation11 in homes sits today – because that sharp bend in the graph has big implications for how builder’s build homes.
Making a layer of insulation twice as thick doesn’t save twice the energy. To save twice as much it must be more than twice as thick – and thus the result is a curve not a straight line.
The problem is that making insulation takes energy and resources. As the line gets steeper, it means more energy and resources are required to save more energy from the house – which is where the function for this section comes in.
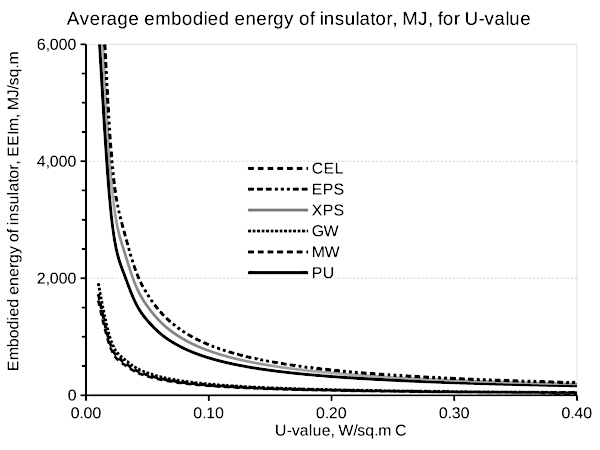
Graph 2. Thermal transmittance (U-value) versus embodied energy
What the heading of this section says, as plotted in the graph here on the right, is:
The thickness of the insulation material in metres, Tm;
Multiplied by the bulk density of the material in kilos per cubic metre, Dm;
Multiplied by the ‘embodied energy’14, in mega-Joules (MJ), required to make one kilo of insulation, EEm;
Produces the embodied energy (MJ) of 1m2 of insulation at that U-value, EEIm.
To give you an idea of the scale of energy use here, a kilo-Watt-hour (kW-h) of power in the home is equivalent to 3.6 mega-Joules (MJ) of energy. The average UK home15 uses 10kW-h/day.
Making 1m2 of PU, 0.25m thick to meet the 0.1 U-value required for a Passivhaus roof takes ~640MJ of energy – or about two-and-a-half-weeks of household power consumption. A 21 square metre roof would be a year’s power consumption.
What’s interesting in this graph is the way that the insulation materials now diverge – with cellulose (recycled newspaper or pulp fibre) and glass/mineral wool having a much lower embodied energy than the more highly engineered ‘plastic’ compounds – polyurethane and polystyrene.
We expend energy making insulation – but it saves energy in the process.
Energy flows through the insulation, but at a lower rate the thicker it gets. The value of expending more energy to increase the thickness of insulation will therefore progressively decrease until it saves nothing at all.
To make sense of this we have to add yet more troublesome details – by considering the real world.
Energy flows through the section in proportion to the temperature difference between each side. This means the same thickness of insulation doesn’t work the same way in Cornwall as in Caithness.
Energy auditing16 rarely uses direct temperature measurement; it’s too complex and time consuming. Instead the building’s estimated loss rate is converted to Watts per day per degree, and then that value is multiplied by the number of ‘heating degree days’17 for the area. Each degree day represents a difference of one days worth of heat required for each degree of difference in average monthly or annual temperature.
What must be measured is ‘total’ energy use, both the direct use in home heating and the indirect use to manufacture insulation – which is where function for this section comes in.
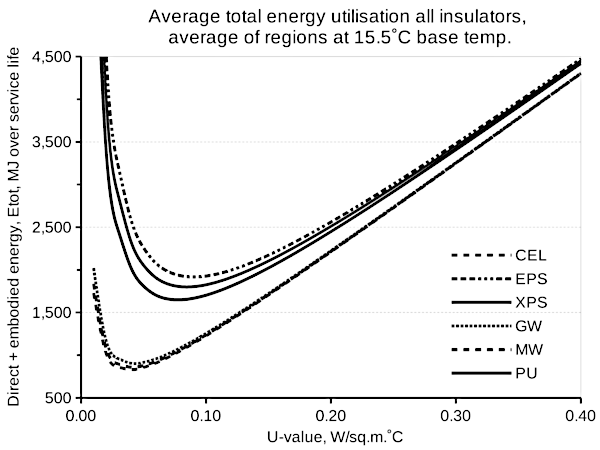
Graph 3. U-value versus lifetime direct + embodied energy flow
What the heading of this section says, as plotted in the graph on the right, is:
The embodied energy of the insulation material for that U-value, EEIm,u (MJ), is added to the product of –
The U-value required, Um;
Multiplied by 3600 × 24 to convert seconds into hours and hours into days;
Multiplied by the annual number of ‘heating degree days’ in the region where the building is located, DDr;
Multiplied by the life of the building in years, L;
Will produce Etot, the total direct and indirect energy use in MJ per metre square.
The graph this produces looks a bit like the ‘Nike swoosh’. As the U-value increases, the energy loss increases too as more direct energy is required to heat the home. That means the graph has a defined ‘heel’, where adding insulation ceases to have any benefit, and instead quickly becomes a ‘cost’ due to the increase in indirect embodied energy.
The building’s internal temperature has a big effect on degree days. For a standard house, assumed to be heated to around 18˚C-20˚C, a base temperature of 15.5˚C is often used to calculate degree days. The difference between 15.5˚C and 18˚C is provided by other ‘thermal gains’ – heat sources such as cookers, appliances, and people, or the heat from the sun shining through the windows.
The graph above uses 2,054 degree days.
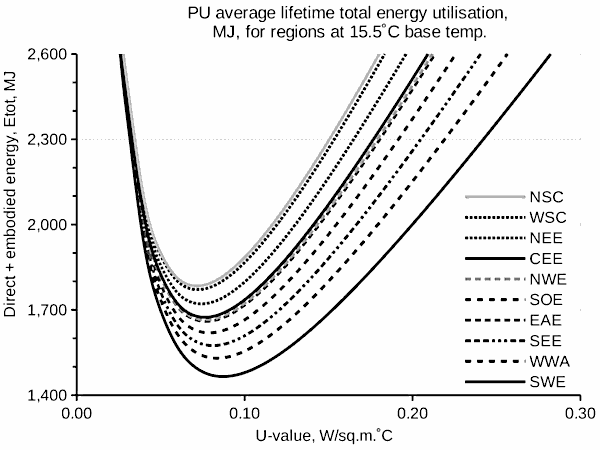
Graph 4. Polyurethane U-value versus lifetime direct + embodied energy flow for different UK regions
The lifetime of the building is also a complex thing to put a number on. Is it a new build, or a refurbishment? The remaining service life of the materials has a big effect on the net energy balance. These calculations use a lifetime of 60 years in a new build, as that’s the design life of many mass-market homes these days.
You’ll note that for the highly engineered insulation materials that heel is at a U-value around 0.1 – the current level for Passivhaus design.
Now let’s turn that last graph around: Instead of an ‘average’ of the regions lets take all ten (the region IDs are listed in the table at the end of the page); but to make the graph readable let’s reduce the insulation materials from six to one – polyurethane.
What the graph to the right shows is that the energy balance for Northern Scotland (NSC) is not the same as for Southwest England (SWE). This creates another complication: We can’t specify a national standard as “one size does not fit all”. We need more localised eco-building standards (as is already the case in countries such as France18), reflecting the effects of varying local climate.
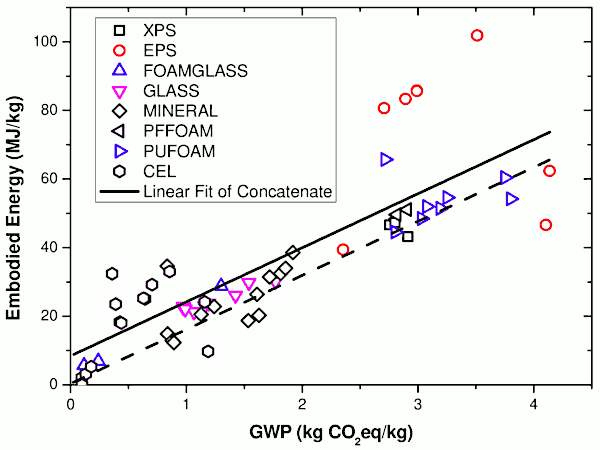
Graph 5. Global Warming Potential (GWP) versus embodied energy for various insulation types (from Hill et al. 201719)
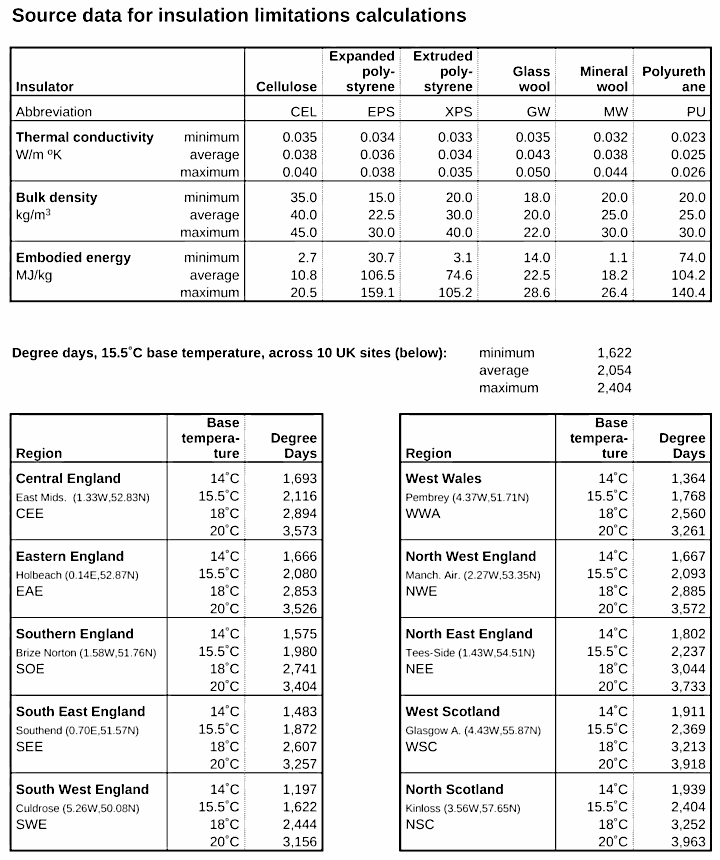
The graph to the right is from a recent paper by Hill et al. which provides a meta-analysis of many different life-cycle studies of insulation materials, from different manufacturers. Many of the figures used in this post were taken from it (see table at the end of the page).
The graph shows that when embodied energy is plotted against global warming potential (GWP) different types of insulation group together. The problem is that they do not group together tightly.
The studies reviewed by Hill et al. had a spread of values where the highest was a factor of 1.5 to 3-times the lowest value for each type.
Is that data good enough to base an entire policy upon? I would argue not. We can romanticise the elegant simplicity of mathematical methods, but the hard reality is that we need much better data than that to work with any practical certainty.
Let’s review what we can state with some certainty then:
Adding more insulation to reduce heat loss is not an open-ended, always improving process. At some point, quite close to where current standards are set, it increases energy consumption rather than decreasing it.
Where those limits sit will differ in Exeter, Edinburgh, and Eastbourne, further complicating assessment procedures.
Quite apart form the fact that UK domestic energy consumption is roughly a quarter of national consumption, the fact is we’ve reached the limits of how much further those efficiencies can be significantly improved without simply shifting direct to indirect20 consumption. The only way to reduce domestic energy consumption significantly now is to “turn things off”, not try to make them use less energy by making them more highly engineered.
As energy demand shifts from direct to indirect consumption, that puts the emphasis on lifestyle21 as the major contributor to global emissions, especially the trade in manufactured goods22 – for which there is no solution but ‘having less stuff’.
There are many other ways to examine this issue that I’ve barely touched upon. For example, I outlined how a ‘base temperature’ is used to determine degree days. What I did not say is that the 15.5˚C figure used as standard for many ‘abstract’ energy audits is unrealistic today as many people run their house at 20˚C-21˚C. A base temperature of 18˚C should really be used instead – which results in direct energy consumption increasing by 40%.
In contrast, if the house is run at a temperature 1.5˚C to 2˚C lower, resulting in a base temperature of 14˚C, the reduction in heating days reduces direct energy consumption by 20%.
In the end, the fact is that a lot of ‘ecological footprinting’23 analysis is actually quite uncertain as it operates within the subjective assumptions24 of those preparing the data. Given insulation standards are already set near to the demonstrable “zero return” point for improving insulation, we have to ask whether tightening standards is a realistic goal to reduce emissions. Do we instead need to shift towards non-technological alternatives to ‘more insulation’?: Such as turning down the thermostat and putting a jumper on; or better still, turning off an awful lot of household gadgets – including many of the ‘green’ technologies that the highest specification eco-design25 systems use to ‘save’ energy and emissions.