
What is ‘Renewable’ Energy?
From the media debate it may seem obvious what ‘renewable’ energy is. When the Government describe how they are meeting their targets, however, what they’re talking about is a collection of very different sources and technologies.

We may think that the Government is encouraging wind or solar farm construction to ‘green’ our energy system. That is not, and has never been the case.
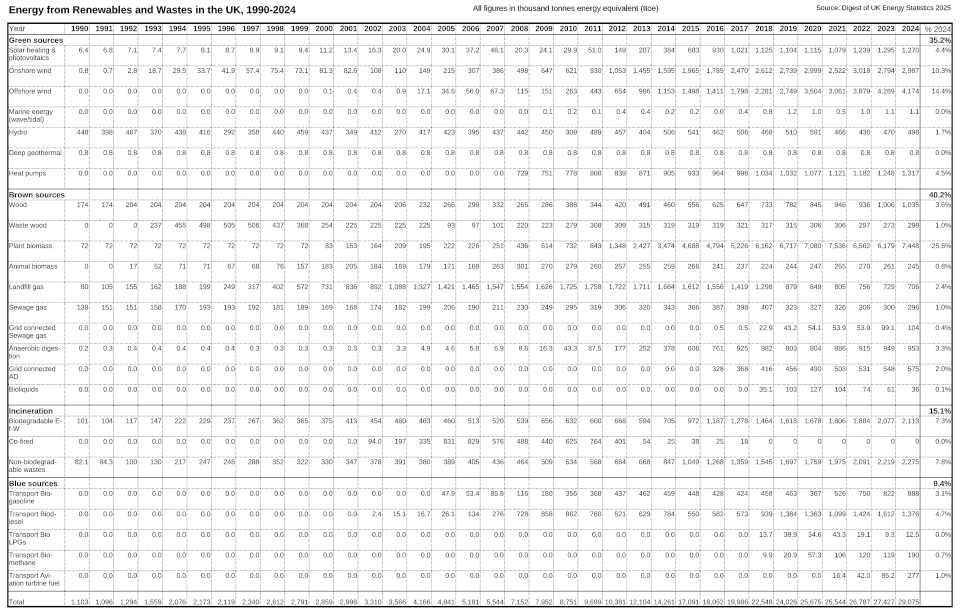
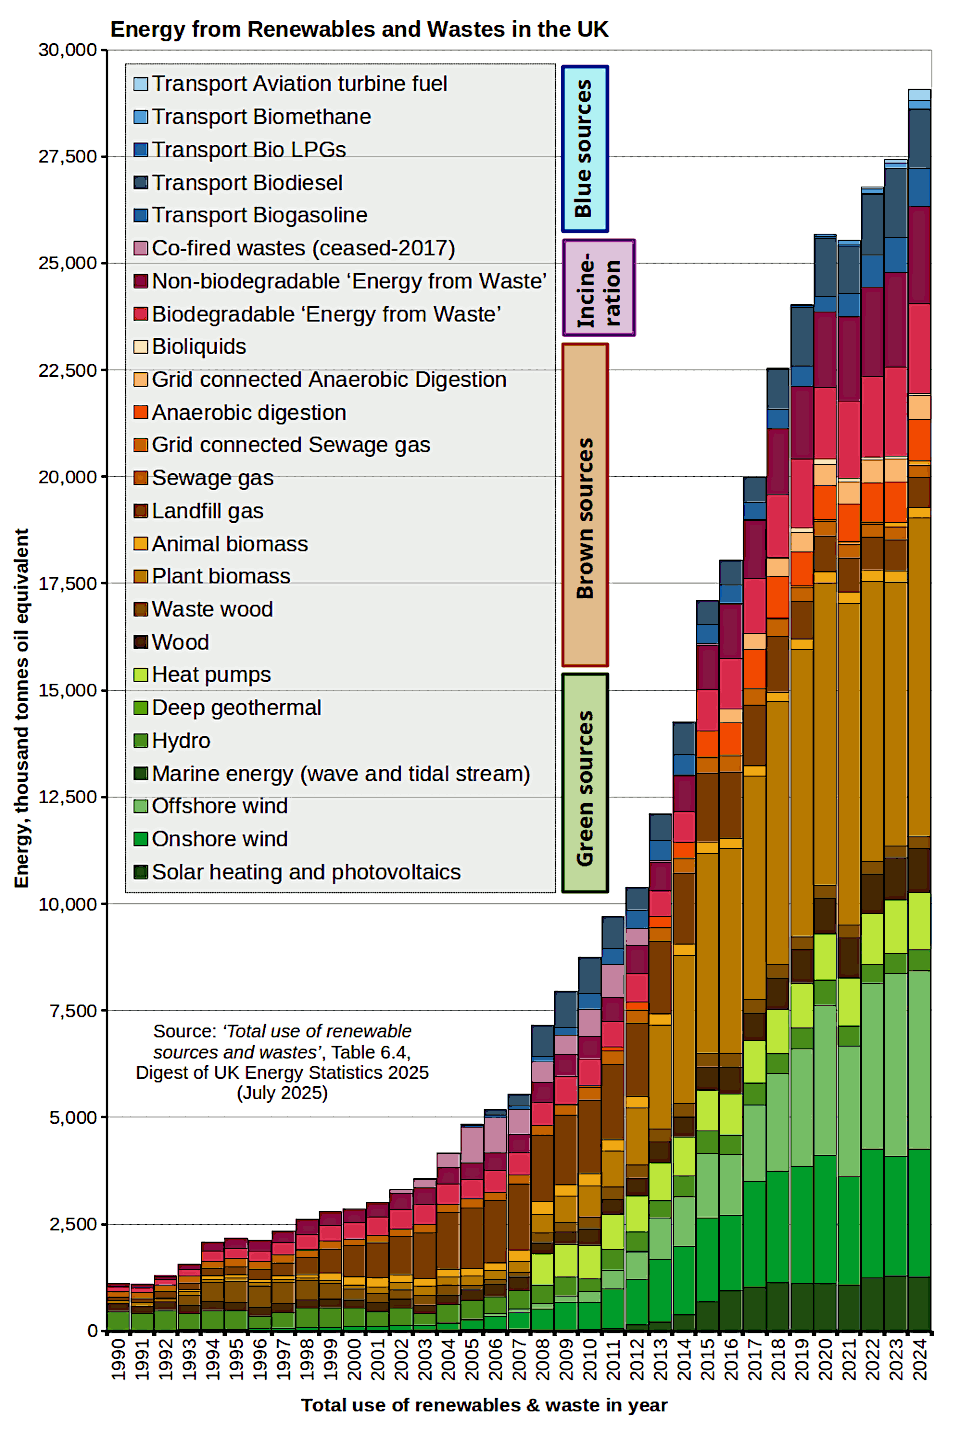
The graph and data to the right comes from the Government’s annual energy publication, ‘Digest of UK Energy Statistics 2025’. Each year this lays out all the data kept about Britain’s energy economy – all energy production, imports, exports, and how it was used across the nation by different economic sectors.
The kinds of energy sources we might consider ‘renewable’ – wind, solar, tidal, etc. – we could call ‘green’ sources. Together these make-up just over a third (35%) of what is classed as, ‘renewable’.
Next there are ‘brown’ sources – technologies primarily related to waste disposal and plant/woody materials: Some of these, such as landfill gas, are marginally better for the environment because they negate pollution; while others, such as anaerobic digestion, are far more debatable – and may actually harm the environment if operated poorly. These are the source of two-fifths (40%) of renewable energy.
Then there is ‘waste incineration’, about one-sixth (15%) of the total. This destroys resources which could have been recycled, recovering only a small fraction on the energy invested in them – while producing electricity that emits more carbon dioxide per unit than the coal-fired power stations we recently closed.
Finally there is what we might call ‘blue’ sources, mostly road or aviation fuels, making up just under a tenth (9.4%) of the total. The curious thing is: Some of these, like ‘sustainable’ aviation fuels, may take more energy to make than they contain; while others, such as bioethanol, may save or capture no meaningful amount of carbon dioxide when they are used.
Academic studies investigating the impact of using these energy sources and fuels demonstrate that while they may reduce some environmental impacts on paper, when we look at the entire life-cycle of how they are used they do not necessarily reduce carbon emissions, or other forms of ecological damage.
Finally, in terms of the energy or fuels used, across all ‘renewable’ sources a fifth (21%) of the annual energy value is imported. However, for some sources that figure rises to a half (‘plant biomass’, 56%) or even two-thirds (‘liquid biofuels’, 70%).
Britain’s entire ‘renewable’ energy system is a mess: It does not prevent environmental damage, it destroys resources, and it dresses-up a waste disposal agenda as ‘green’ when no objective assessment could possibly describe it as such.
UK ‘Renewables and Waste’ Energy Sources, 2024
Below is a detailed breakdown of the various renewable and waste energy sources cited in the Digest of UK Energy Statistics for the year 2024 – subdivided by the ‘colour’ attached to them in the chart:
- Solar PV 1,270 ttoe; 4.4% ‘renewable’ supply; 0.75% energy supply.
- There are over 1.6 million rooftop & ground-based PV installations, but generation figures are dominated by solar farms. This data only includes grid-connected sites. Those doing ‘DIY’ installations off-grid are not included here, only those in various government schemes.
- On-shore wind 2,987 ttoe; 10.3% ‘renewable’ supply; 1.77% energy supply.
- There are almost 10,000 sites generating wind energy on-shore, but these figures are dominated by the largest wind farms on high ground. Each nation currently has different wind farm policies, with Scotland the most proactive and England the most restrictive. These figures do not include ‘DIY’ off-grid generators, only those feeding into the grid.
- Off-shore wind 4,174 ttoe; 14.4% ‘renewable’ supply; 2.47% energy supply.
- There are 49 large off-shore wind farms producing more power than on-shore sites due to higher wind-flows at sea. Current policy seeks greater off-shore development for this reason.
- Marine energy (wave and tidal stream) 1.1 ttoe; 0.004% ‘renewable’ supply; 0.0007% energy supply – too small to be visible on this graph.
- There are currently 4 sites – still largely experimental – producing energy from the tide or sea currents. While promising, the higher costs makes it less economic except for more isolated sites, such as island communities where other options (e.g. cables form mainland) would be more costly.
- Hydro-power 489 ttoe; 1.7% ‘renewable’ supply; 0.3% energy supply.
- There are 355 large hydro-power sites and over 1,200 small sites. This figure does not include off-grid micro-hydro sites. Figures for hydro have fallen in recent years as a result of more erratic Winter rainfall and Summer-time droughts.
- Deep geothermal 0.8 ttoe; 0.003% ‘renewable’ supply; 0.0005% energy supply – too small to be visible on this graph.
- A few sites in UK produce heat from deep rocks, using heat pumps to boost temperature for space heating use.
- Heat pumps 1,320 ttoe; 4.5% ‘renewable’ supply; 0.78% energy supply.
- Heat pumps use electricity to ‘pump’ between two to six times the equivalent heat from a low temperature source – either air, ground, or water – boosting the temperature for space/water heating.
- Wood (solid wood/logs) 1,035 ttoe; 3.6% ‘renewable’ supply; 0.64% energy supply.
- A (possibly very wrong) estimate of wood burnt for heating. Approximately 7% of households burn wood, with less than 1% using it as their main source of heat.
- Waste wood 298 ttoe; 1% ‘renewable’ supply; 0.18% energy supply.
- Typically this is waste wood from plants handling wood – such as sawmills – which burn it as a source of heat.
- Plant biomass 7,450 ttoe; 25.6% ‘renewable’ supply; 4.41% energy supply.
- Plant biomass includes straw, coppice, and other plant based biomass burnt for space heating and/or power generation. Most of this material is imported wood biomass or waste straw. These figures only include sites which burn wastes under official schemes. ‘DIY’ use not included.
- Animal wastes 245 ttoe; 0.8% ‘renewable’ supply; 0.14% energy supply.
- Waste bedding, poultry litter from chicken farms, and meat and bone from meat processors, burnt to produce heat & power.
- Landfill gas 706 ttoe; 2.4% ‘renewable’ supply; 0.42% energy supply.
- Around 450 sites use landfill gas to produce power. Reduces climate impact by converting contaminated methane to CO2. Has declined as more waste diverted to waste incineration.
- Sewage gas 296 ttoe; 1% ‘renewable’ supply; 0.18% energy supply.
- Gas from anaerobic digestion of sewage at ~200 larger treatment works. This reduces climate impact of sewage, & offsets some power demand from sewage treatment.
- Grid-connected Sewage gas 104 ttoe; 0.4% ‘renewable’ supply; 0.06% energy supply.
- Largest sewage works producing enough gas for national gas/power supply grid
- Anaerobic digestion (AD) 953 ttoe; 3.3% ‘renewable’ supply; 0.56% energy supply.
- Gas/power produced from anaerobic digestion of organic wastes at plants/farms producing a biodegradable waste stream.
- Grid-connected Anaerobic digestion 575 ttoe; 2% ‘renewable’; 0.34% energy.
- As AD below-right, but producing enough gas to connect to national gas/power supply grids.
- Bioliquids 36.5 ttoe; 0.13% ‘renewable’ supply; 0.02% energy supply.
- Refineries producing liquid fuels such as bioethanol/biomethanol.
- Biodegradable ‘Energy from Waste’ 2,113 ttoe; 7.3% ‘renewable’; 1.25% energy.
- Waste burnt at around 70 plants, primarily burning municipal waste, to produce heat and power – with a carbon footprint greater than burning coal.
- Non-biodegradable ‘Energy from Waste’ 2,275 ttoe; 7.8% ‘renewable’ supply; 1.35% energy supply.
- Other forms of incineration producing heat and power, including use of car tyres & other more hazardous wastes.
- Transport Bio-gasoline 888 ttoe; 3.1% ‘renewable’ supply; 0.53% energy supply.
- Bioethanol additive for ‘E10’ petrol made from fermented & distilled crops or crop wastes.
- Transport Bio-diesel 1,376 ttoe; 4.7% ‘renewable’ supply; 0.81% energy supply.
- Road diesel made from plant oils, waste oils, or animal processing wastes.
- Transport Bio-LPG 12.5 ttoe; 0.64% ‘renewable’ supply; 0.11% energy supply – too small to be visible on this graph.
- Propane/butane biogas used as an LPG equivalent for road vehicles.
- Transport Bio-methane 190 ttoe; 0.64% ‘renewable’; 0.11% energy supply.
- Methane biogas from anaerobic digestion for road vehicles.
- Transport Aviation Turbine Fuel 278 ttoe; 1% ‘renewable’ supply; 0.16% energy supply.
- ‘Sustainable’ (though arguably not for a number of reasons) aircraft fuels produced by specialist refineries from waste and/or chemical feedstocks.
‘Green’ sources:
‘Green’ sources are the kinds of energy we might consider ‘renewable’ – wind, solar, tidal, etc. Together these make-up just over a third (35%) of what is classed as, ‘renewable energy’.
‘Brown’ sources:
‘Brown’ sources are technologies related to waste disposal and plant/woody materials: Some of these, such as landfill gas, are marginally better for the environment because they negate pollution; while others, such as anaerobic digestion, are far more debatable – and may actually harm the environment if operated poorly. ‘Brown’ sources produced two-fifths (40%) of renewable energy.
‘Incineration’ sources:
‘Waste incineration’ is about one-sixth (15%) of the total. This destroys resources which could have been recycled, recovering only a small fraction on the energy invested in them – while producing electricity that emits more carbon dioxide per unit than the coal-fired power stations we recently closed.
‘Blue’ sources:
Road or aviation fuels, making up just under a tenth (9.4%) of the total. The curious thing is: Some of these, like ‘sustainable’ aviation fuels, may take more energy to make than they contain; while others, such as bioethanol, may save or capture no meaningful amount of carbon dioxide when they are used.